
Visibility, Control & Insight at Your Fingertips
USER INTERFACE
Behind every packet inspected and every policy enforced lies one critical question: Can your team see what matters and act on it quickly?
Our Web-Based User Interface turns complex network data into clear, customizable, real-time dashboards and workflows that help network operators, government analysts, and security teams do their jobs better, faster, and smarter.

Network Intelligence • Visualized, Simplified, & Actionable
Our analytics platform provides real-time visibility into network traffic, user behavior, and application usage through intuitive dashboards and interactive visualizations. With advanced filtering, session drill-downs, geolocation mapping, and trend reporting, the Quant Azimuth UI empowers operators to detect anomalies, investigate events, and make confident, data-driven decisions. Features include:

1. Real-Time Dashboards
• Monitor live traffic flows, application usage, and session statistics
• Visualize by:
◦ User/Subscriber ID
◦ Protocol/Application
◦ IP/Geo-location
◦ Device type or access network (mobile/fixed/satellite)
• Instant detection of anomalies, spikes, or suspicious patterns.

2. Advanced Filtering & Search
• Powerful multi-parameter search tools:
◦ IMSI, MSISDN, IP, MAC, Cell ID, Time Range.
◦ Protocol type, Application name, Encrypted traffic detection.
• Filter by traffic behavior, geographic location, or user group.

3. Drill-Down Session Views
• Inspect individual sessions or flows with complete metadata.
• View protocol dissection details, timestamps, session duration, and endpoints.
• Great for investigations, forensics, and lawful intercept validation.

4. Geolocation & Heat Maps
• Real-time and historical mapping of user activity.
• Visualize traffic origin/destination patterns (national and cross-border).
• Identify hotspots of suspicious behavior or network congestion.

5. Analytics & Trend Reports
• Create reports on:
◦ Application usage over time
◦ VPN/P2P penetration rates
◦ Encrypted traffic trends
◦ User/device behavioral profiles
• Ideal for compliance reporting, business analysis, and strategic planning.
Built for Different User Roles
Each role can have custom views, access permissions, and workflow tools tailored to its function.
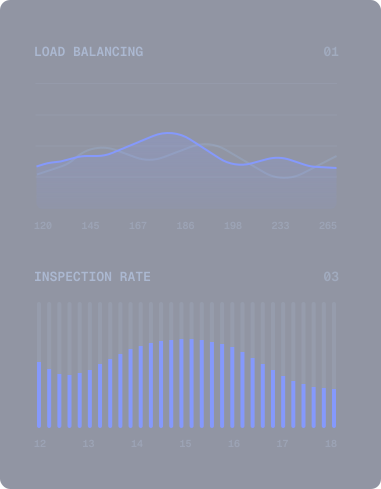
Network Engineer
• Traffic stats, QoS, protocol performance.
Technology & Architecture Highlights
Our platform combines modern, web-based architecture with a responsive, multi-language interface designed for desktop and tablet use. With role-based access control, real-time data integration, and REST API support, this delivers secure, flexible, and embeddable insights for international and government deployments, including:

• Web-based, responsive interface (works on desktop & tablets).

• Built using modern UI frameworks (React / Angular / Vue-based, depending on deployment).

• Supports multi-language UI for international and government clients.

• Fully role-based access control (RBAC) - defines who sees what.

• REST API available for embedding visual components into third-party portals.

• Data sourced directly from the Database Layer and updated in real-time via the Mediation Layer.

Granular Visibility Is the Foundation of Trust in High-Performance Networks.
Security & Compliance
• Multi-factor authentication (MFA)
• Full audit trails and session logging
• Optional integration with LDAP / Active Directory.
• Granular access rights per feature/module.
• User session timeout & account lockout policies.
Value Proposition

Clarity
• Turn raw DPI data into intuitive visuals.

Speed
• Find users, sessions, or patterns in seconds.

Control
• Trigger actions or export insights instantly.

Compliance
• Meet reporting obligations with confidence.

Collaboration
• Share views across departments and agencies securely.